Image Details
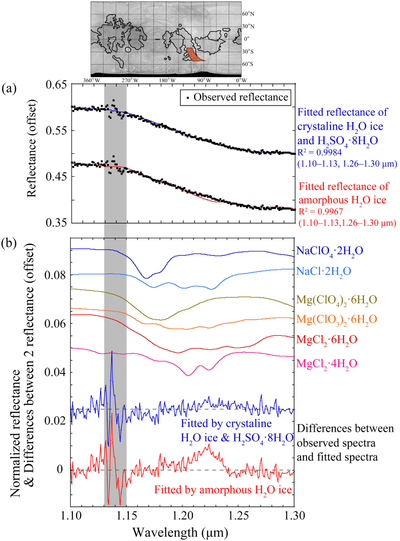
Caption: Figure 8.
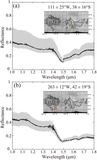
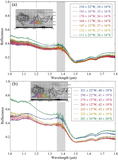
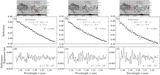
Analysis of the shape of the reflectance spectra at 111° ± 25°W, 38° ± 16°S at wavelengths of 1.100–1.300 μm. (a) Close-up view of the reflectance spectra fitted by the calculated H2O-ice spectra. (b) Normalized spectra of hydrated Cl-bearing salts compared with differences between the observed and fitted H2O-ice spectra as a function of wavelength. Reflectance spectra of H2O ice are calculated using the Hapke model (Hapke 1981, 1993, 2002) with the optical constants for amorphous H2O ice at 70–130 K (Mastrapa et al. 2008), crystalline H2O ice at 120 K (Grundy & Schmidt 1998), and H2SO4 · 8H2O at 77 K (Carlson et al. 2005). The optical constants of H2O ice are supplemented with optical constants from Warren & Brandt (2008). The reflectance of H2O ice is fitted to the observed reflectance using the least-squares method at wavelengths of 1.100–1.130 μm and 1.255–1.300 μm. In the best fit with crystalline H2O ice plus H2SO4 · 8H2O, the mixing ratios of H2O ice and H2SO4 · 8H2O are calculated as 54% and 46%, respectively. Offsets have been added to the differences and the normalized spectra for clarification. The gray bar represents the wavelengths corresponding to telluric atmospheric absorption (1.13–1.15 μm). The normalized spectra of hydrated Cl-bearing salts are not scaled to their upper limits to the abundances.
Other Images in This Article


Show More
Copyright and Terms & Conditions
© 2022. The Author(s). Published by the American Astronomical Society.