Image Details
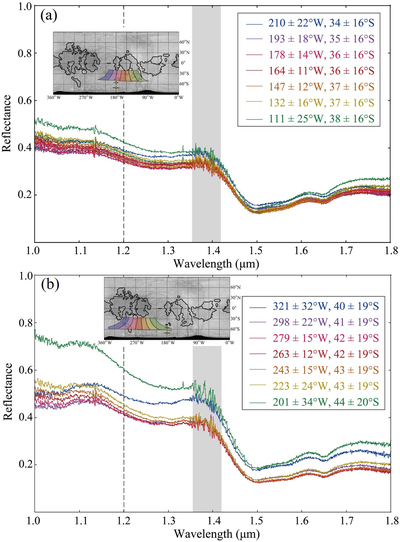
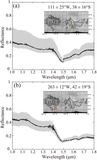
Caption: Figure 7.
Connected reflectance spectra of Europa’s surface at wavelengths of 1.0–1.8 μm. The observed area on Europa is shown in the upper left inset. (a) Data for the southern regions in the leading hemisphere observed on 2019 May 17. (b) Data for the southern regions in the trailing hemisphere observed on 2019 May 18. Gray bars represent the wavelengths corresponding to telluric atmospheric absorption (1.35–1.42 μm). Vertical dashed lines indicate a wavelength of 1.2 μm. In the reflectance spectra, we observe no significant absorption features around 1.2 μm, where hydrated Cl-bearing salts exhibit their characteristic absorption features.
Other Images in This Article


Show More
Copyright and Terms & Conditions
© 2022. The Author(s). Published by the American Astronomical Society.