Image Details

Caption: Figure 5.
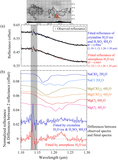
Observed regions on Europa’s surface map (image credit: USGS Map-a-planet). The green and yellow areas were observed on 2019 May 17 and 18, respectively. The green region covers the southeastern region of the trailing hemisphere (210°–180°W, 20°–50°S) and the southwestern region of the leading hemisphere (180–110°W, 20–50°S). The yellow area covers the southern region of the trailing hemisphere (330°–190°W, 30°–60°S). The gray area covers a part of the northern regions of the trailing hemisphere (256° ± 5°W, 15° ± 14°N). The red area covers a part of the equatorial regions of the leading hemisphere (160° ± 9°W, 3° ± 15°N). The spectral data of two areas are used for the estimations for hydrated Cl-bearing salts (see detailed in Section 4). The regions outlined by thick black lines enclose chaotic terrains (Doggett et al. 2009).
Other Images in This Article


Show More
Copyright and Terms & Conditions
© 2022. The Author(s). Published by the American Astronomical Society.