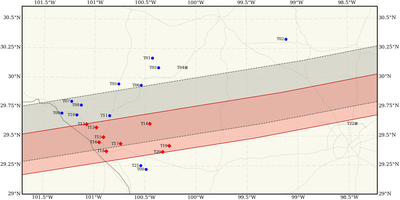
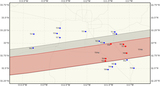
Image Details

Choose export citation format:

Size and Shape of (11351) Leucus from Five Occultations

  • Authors: Marc W. Buie, Brian A. Keeney, Ryder H. Strauss, Ted E. Blank, John G. Moore, Simon B. Porter, Lawrence H. Wasserman, Robert J. Weryk, Harold F. Levison, Catherine B. Olkin, Rodrigo Leiva, Jerry E. Bardecker, Michael E Brown, Lilah B Brown, Michael P. Collins, Hugh M. Davidson, David W. Dunham, Joan B. Dunham, John A. Eaccarino, Tiffany J. Finley, Lindsay Fuller, Maria L. Garcia, Tony George, Kai Getrost, Megan, T. Gialluca, Rima M. Givot, David Gupton, William H. Hanna, Carl William Hergenrother, Yamir Hernandez, Bryan Hill, P.C. Hinton, Timothy R. Holt, Robert R Howell, Jack Lee Jewell, Roxanne L. Kamin, Joshua A. Kammer, Theodore Kareta, Gregory J. Kayl, John M. Keller, David A. Kenyon, Scott R. Kester, John N. Kidd, Tod R. Lauer, Cecilia W.S. Leung, Zoey R. Lorusso, Christopher B. Lundgren, Lizeth O. Magana, Paul D. Maley, Franck Marchis, Robert L. Marcialis, Andrew E. McCandless, Delsie Joy McCrystal, Allison Marie McGraw, Kelly E. Miller, Beatrice E.A. Mueller, J.W. Noonan, Aart M. Olsen, Alexander R. Patton, Daniel O'Conner Peluso, Michael J. Person, James G. Rigby, Alex D Rolfsmeier, Julien J. Salmon, Joseph Samaniego, R.P. Sawyer, David M. Schulz, Michael F Skrutskie, Rose J.C. Smith, John R. Spencer, Alessondra Springmann, Dale R. Stanbridge, Timothy J Stoffel, Peter Tamblyn, Bryan Tobias, Anne J. Verbiscer, Michael P. von Schalscha, Holly Werts, and Qicheng Zhang

2021 The Planetary Science Journal 2 202.

  • Provider: AAS Journals

Caption: Figure 8.

Map of the LE20181118 occultation. The gray region delimited by dashed lines represents the predicted track with a notional diameter of 45 km. The red shaded region delimited by solid lines shows the actual occultation zone. The observing locations are shown labeled by their site codes. Blue circles indicate good data with no occultation. Red diamonds indicate good data with a positive occultation detection. Gray squares indicate sites unable to collect useful data. The border between Texas and Mexico appears in the lower left corner of the map. Faint gray lines show major highways.

Other Images in This Article

Show More

Copyright and Terms & Conditions