Image Details
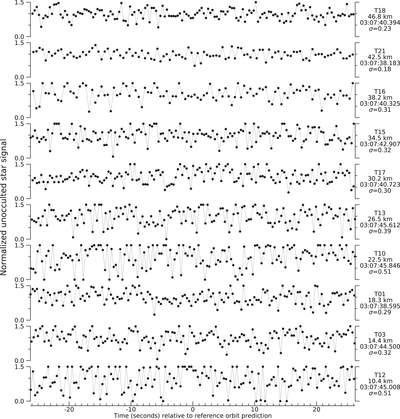
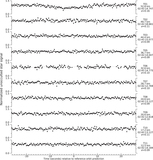
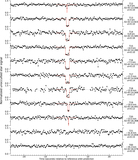
Caption: Figure 5.
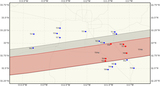
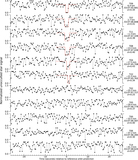
Light curves for LE20181114, part 1. The plots are clipped at 0 and 1.5 for clarity. The labels on the right identify the team, the cross-track offset relative to the final prediction, the reference mid-time, and the standard deviation of the per-point scatter. For those events with a positive detection, the occultation model (in red) is shown as well. The data used for the figure (without clipping) are provided in electronic form.
(The data used to create this figure are available.)
Other Images in This Article
Show More
Copyright and Terms & Conditions
© 2021. The Author(s). Published by the American Astronomical Society.
Copyright ©
2025 Astronomy Image Explorer. All Rights Reserved.