Image Details
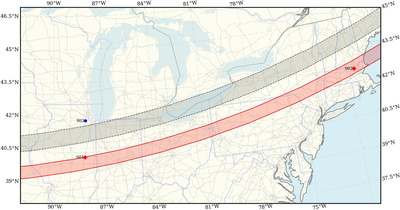
Caption: Figure 1.
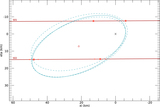
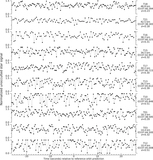
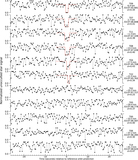
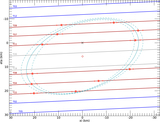
Map of the LE20171018 occultation. The gray region delimited by dashed lines represents the predicted track with a notional diameter of 45 km. The red shaded region delimited by solid lines shows the actual occultation zone. The observing locations are shown labeled by their site codes. Blue circles indicate good data with no occultation. Red diamonds indicate good data with a positive occultation detection. Faint gray lines show major highways.
Copyright and Terms & Conditions
© 2021. The Author(s). Published by the American Astronomical Society.


