

Image Details
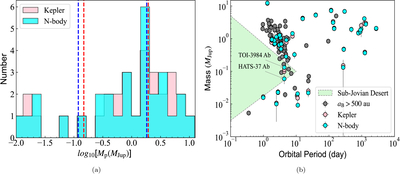
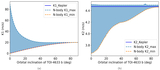
Caption: Figure 3.
(a) The histogram plot of the first 30 target S-type planets with a2 < 100 au in Kepler and N-body models. We utilized KDE to estimate the regional smoothed peak value of planetary masses. Left two lines represent the smoothed peak values of Mp,Kepler = 0.15 MJup (red) and Mp,N−body = 0.12 MJup (blue) for intermediate-mass planets with Mp < 1 MJup, the decreasing rate is 20%. The right blue and red dashed lines represent the smoothed regional peak values of Mp for Jovian planets with 1 MJup < Mp < 5 MJup, Mp,Kepler = 1.94 MJup (red) shifts slightly to Mp,N−body = 1.80 MJup (blue), with a decline rate of 7.2%. (b) The mass–orbital period distribution of 29 S-type planets in close-in binaries together with 11 transiting planets in wider binaries. Pink dots for the Keplerian masses and cyan dots for the N-body masses, gray dots in the background refer to the remaining single S-type planets.
Other Images in This Article
Show More
Copyright and Terms & Conditions
© 2026. The Author(s). Published by the American Astronomical Society.

