

Image Details
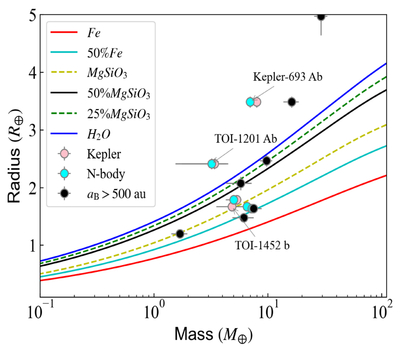
Caption: Figure 4.
Mass–radius diagram for transiting sub-Jovian S-type planets with masses <100 M⊕. We retrieval planetary masses of single transiting S-type planets in pink with the N-body model; cyan dots are the dynamical masses for those with the same radius. Comparing with the Keplerian model, our N-body fitting results slightly shift TOI-1452 b to the right with higher density, but shift TOI-1201 Ab and Kepler-693 Ab to the left with lower density. Density curves in different colors are adopted from L. Zeng et al. (2016).
Other Images in This Article
Show More
Copyright and Terms & Conditions
© 2026. The Author(s). Published by the American Astronomical Society.

Copyright ©
2026 Astronomy Image Explorer. All Rights Reserved.
