

Image Details
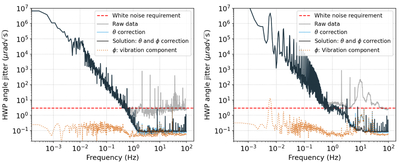
Caption: Figure 3.
Amplitude spectral density of the rotation angle jitter for a 2 Hz rotation, measured over approximately 1 hr of data for SAT3. Left panel: the spectrum when the telescope is stationary. The gray line shows the spectrum of raw data. The 1/f noise is due to rotation speed variation and is not an encoding error. The peak at 2 Hz and its harmonics along with the elevated noise above 2 Hz are due to the periodic bias of the rotation angle. The blue and black lines, representing the spectrum with corrections, exhibit a flat white noise profile. Right panel: the spectrum when the telescope is scanning. The scan-induced modulation of the rotation seen at 6 mHz and its harmonics are not encoding errors. The scan-induced vibration of the rotor at around 10 Hz is seen in blue line, and it is successfully subtracted in the black line representing the spectrum of the solution. The orange line shows the effect of vibration subtracted from the blue line, which corresponds to the difference of angle measured by two encoders (Equation (A5)). The horizontal red dashed line marks the requirement of noise level.
Other Images in This Article
Show More
Copyright and Terms & Conditions
© 2026. The Author(s). Published by the American Astronomical Society.

