

Image Details
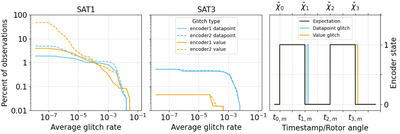
Caption: Figure 2.
The left and middle panels show the distribution of glitched encoder counts separated by glitch type and platform. A typical observation is 1 hr and contains approximately 107 encoder counts. Glitches found for SAT2 were minimal among three SATs, and not reported explicitly. The right panel shows an idealized data point glitch and value glitch, along with an expected digitized encoder signal.
Other Images in This Article
Show More
Copyright and Terms & Conditions
© 2026. The Author(s). Published by the American Astronomical Society.

Copyright ©
2026 Astronomy Image Explorer. All Rights Reserved.
