

Image Details
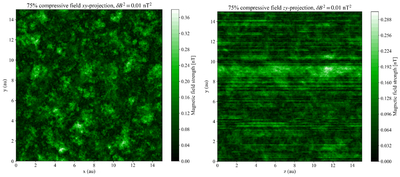
Caption: Figure 2.
Magnitude projections of a turbulent field with an isotropic component as depicted in Figure 1, but with a compressibility Z of 75%. The spatial variation of the field strength is shown both in planes perpendicular (left panel) and parallel (right panel) with respect to the background field direction. Spectral forms are discussed in Section 2.5.
Other Images in This Article
Show More
Copyright and Terms & Conditions
© 2026. The Author(s). Published by the American Astronomical Society.

Copyright ©
2026 Astronomy Image Explorer. All Rights Reserved.
