

Image Details
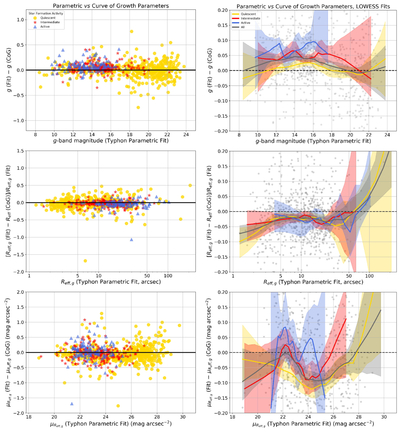
Caption: Figure 20.
Left panels: as Figure 18, but with galaxies color coded according to global star formation activity: quiescent, intermediate, and active (see Section 5.5). See the text for further details. Right panels: as the left panels, but showing LOWESS fits and associated 95% confidence limits to the data. The fits are performed for the entire sample and separately for galaxies of different star formation activity, as shown in the legend. Data points are shown as gray dots; note, however, that to better show the fits, the y-axis has been expanded compared to the left panels and some points fall outside the range plotted.
Other Images in This Article
Show More
Copyright and Terms & Conditions
© 2026. The Author(s). Published by the American Astronomical Society.

