

Image Details
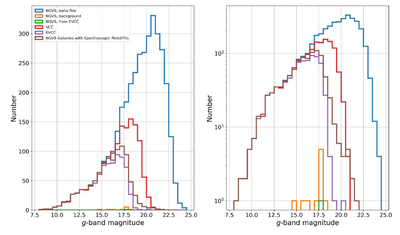
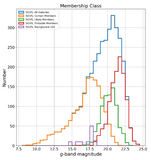
Caption: Figure 4.
Histograms showing the g-band magnitude distributions of all NGVS galaxies. The blue and orange histograms show, respectively, bona fide members and galaxies found, after the fact, to have velocities that place them beyond the v = 3500 km s−1 boundary adopted for Virgo. The green histogram shows the one galaxy, EVCC1010, identified as a Virgo member in the EVCC, but not originally included in the NGVS catalog. The red and violet histograms show NGVS galaxies identified in the VCC and in the EVCC, respectively. Finally, the brown histogram show NGVS galaxies with a measured recessional velocity. The panel to the right is plotted on a logarithmic y-axis to better highlight small samples.
Other Images in This Article
Show More
Copyright and Terms & Conditions
© 2026. The Author(s). Published by the American Astronomical Society.

