

Image Details
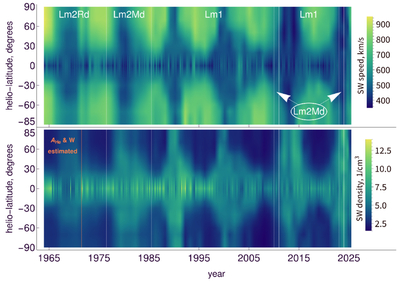
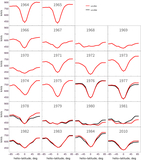
Caption: Figure 3.
Visualization of the entire set of heliolatitudinal profiles of the speed (upper panel) and density (lower panel) reconstruction for the past SCs. The reconstruction method used for the given intervals is indicated in the upper panel. The time interval when proxy-based alpha reconstruction was used is marked in the lower panel in orange.
Other Images in This Article
Copyright and Terms & Conditions
© 2026. The Author(s). Published by the American Astronomical Society.

Copyright ©
2026 Astronomy Image Explorer. All Rights Reserved.
