

Image Details
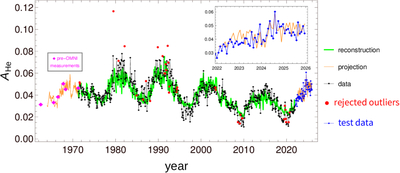
Caption: Figure 1.
Reconstruction and prediction of the SW alpha abundance according to the developed model. The main plot presents the training dataset for the alpha abundance (black dots) and the corresponding reconstructed values obtained from Equation (4) (green points). Red dots mark the original data rejected from the training set. The inset compares the projection of the reconstruction model for a time interval outside of the time interval of the training set (orange) with the actually measured abundances for this interval (blue). In the plot, we also show the pre-OMNI measurements of AHe compared with model projection, illustrating a good agreement between the historic measurements and model prediction in 1964–1971.
Other Images in This Article
Copyright and Terms & Conditions
© 2026. The Author(s). Published by the American Astronomical Society.

