

Image Details
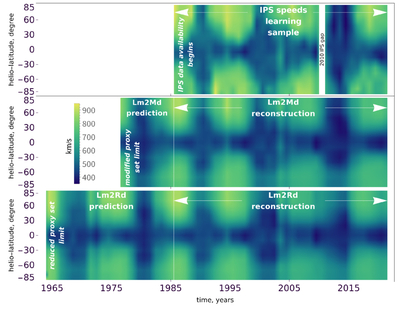
Caption: Figure 2.
A sequence of restoration of the yearly averaged SW speed profiles. The profiles derived directly from IPS (Lm model) are presented in the upper panel, the second panel from the top presents the modified proxy Lm2Md reconstruction, and the third panel from the top presents the reconstruction using the reduced proxy set Lm2Rd. The regions marked as “reconstruction” present the results of the application of the proxy models to the respective proxies for the time intervals for which the training IPS data are available, and the regions marked as “prediction” show reconstruction of the profiles for the times when the IPS data are unavailable. The color scale is presented in the center panel.
Other Images in This Article
Copyright and Terms & Conditions
© 2026. The Author(s). Published by the American Astronomical Society.

