

Image Details
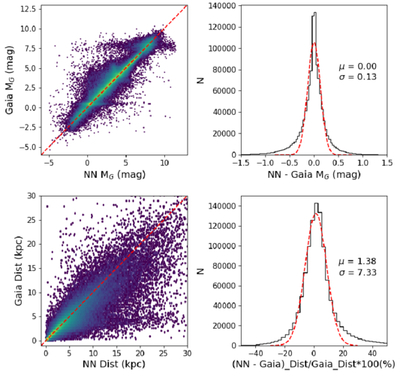
Caption: Figure 19.
Top panels: comparison of neural network MG predictions derived from LAMOST spectra with Gaia MG values. Bottom panels: comparison of distances obtained from NN MG with Gaia distance. Left panels: scatter-density plots comparing NN-predicted values with Gaia-derived values. Right panels: histograms of the differences (top) and the relative percentage errors between the NN and Gaia distances, given by (NN distance – Gaia distance)/Gaia distance × 100%.
Other Images in This Article
Show More
Copyright and Terms & Conditions
© 2026. The Author(s). Published by the American Astronomical Society.

Copyright ©
2026 Astronomy Image Explorer. All Rights Reserved.
