

Image Details
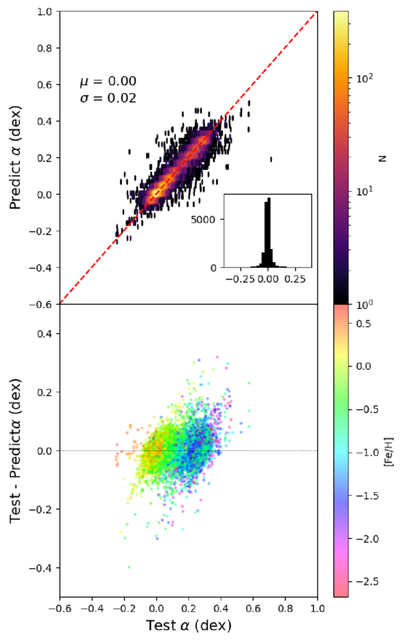
Caption: Figure 2.
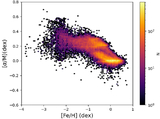
Comparison plot of test samples showing the true and predicted values of [α/M]. Top: a comparison between the predicted [α/M] values and the true values, with points color coded according to the number density of the test samples. Bottom: the residuals between the predicted and true values, with the color indicating [Fe/H].
Other Images in This Article
Show More
Copyright and Terms & Conditions
© 2026. The Author(s). Published by the American Astronomical Society.

Copyright ©
2026 Astronomy Image Explorer. All Rights Reserved.
