

Image Details
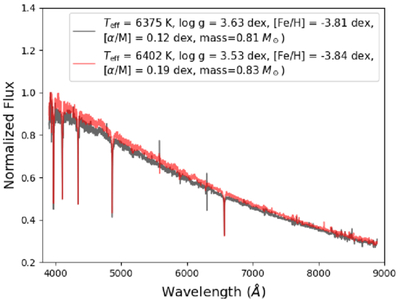
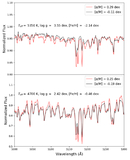
Caption: Figure 9.
Example spectra of two extremely metal-poor stars. The black curve represents an extremely metal-poor subgiant star, while the red curves represents an extremely metal-poor red giant star.
Other Images in This Article
Show More
Copyright and Terms & Conditions
© 2026. The Author(s). Published by the American Astronomical Society.

Copyright ©
2026 Astronomy Image Explorer. All Rights Reserved.
