

Image Details
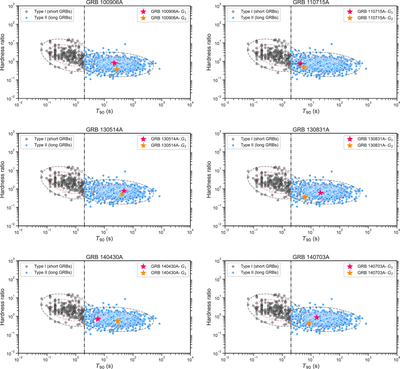
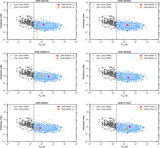
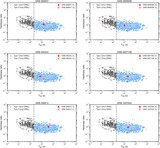
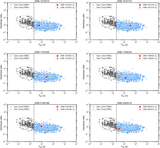
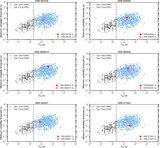
Caption: Figure 4.
Duration–HR diagrams for the 24 analyzed GRBs in our sample. Each panel overlays the ME (G1, magenta star) and EE (G2, orange star) on the GRB population from A. Goldstein et al. (2017), color coded by Type I (short; black) and Type II (long; blue). The ellipses are used only as visual guides to the Type I and Type II regions. Both components lie in the long-GRB region, while G2 is usually displaced toward lower count hardness than G1.
Other Images in This Article
Show More
Copyright and Terms & Conditions
© 2026. The Author(s). Published by the American Astronomical Society.

Copyright ©
2026 Astronomy Image Explorer. All Rights Reserved.
