

Image Details
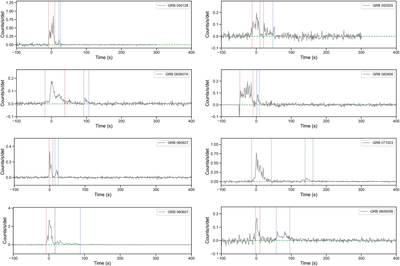
Caption: Figure 1.
Mask-weighted net Swift-BAT light curves for the 24 GRBs in our ME+EE sample. Red and blue dashed vertical lines mark the boundaries of the ME (G1) and EE (G2) episode time windows, respectively. The green horizontal dashed line marks zero count rate. The light curves are plotted directly from the FITS RATE column, in units of counts s−1 det−1. Negative bins are expected for background-subtracted mask-weighted light curves and are retained in all time-integrated measurements.
Other Images in This Article
Show More
Copyright and Terms & Conditions
© 2026. The Author(s). Published by the American Astronomical Society.

Copyright ©
2026 Astronomy Image Explorer. All Rights Reserved.
