

Image Details
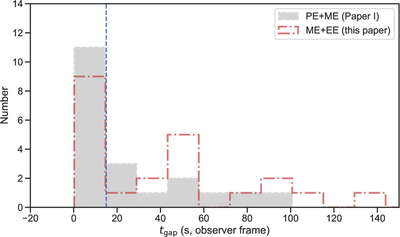
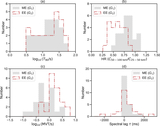
Caption: Figure 3.
Distribution of observer-frame quiescent gap durations, tgap ≡ t1(G2) − t2(G1), for the two pulse-resolved samples analyzed in our series. The filled histogram shows the 24 PE+ME GRBs from Paper I, while the step histogram shows the 24 ME+EE GRBs from Paper II (this work). The vertical dashed line marks tgap = 15 s, illustrating that a good fraction of the events in both samples cluster at short gaps (tgap ≲ 15 s), with a smaller fraction extending to longer quiescent intervals. Histogram counts are shown without normalization.
Other Images in This Article
Show More
Copyright and Terms & Conditions
© 2026. The Author(s). Published by the American Astronomical Society.

Copyright ©
2026 Astronomy Image Explorer. All Rights Reserved.
