

Image Details
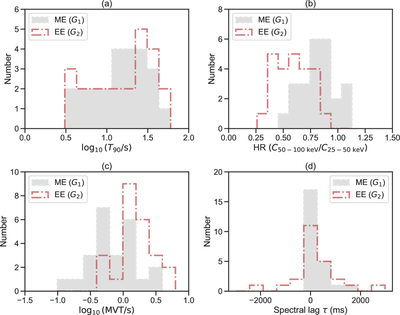
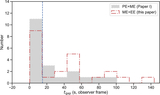
Caption: Figure 2.
Observer-frame distribution comparisons between the ME (G1) and EE (G2) components for the 24 long GRBs in our ME+EE sample. Each panel shows histogram counts (not normalized) for paired episode-level measurements derived in a uniform Swift-BAT bandpass. (a) ﹩{\mathrm{log}}_{10}({T}_{90}\,{{\rm{s}}}^{-1})﹩. (b) Hardness ratio. (c) ﹩{\mathrm{log}}_{10}(\mathrm{MVT}\,{{\rm{s}}}^{-1})﹩, where MVT is the minimum variability timescale measured with the Haar wavelet method. (d) Spectral lag τ (ms) between the 25–50 keV and 15–25 keV bands (positive values indicate that the higher-energy band leads). The ME distributions are shown as filled histograms, and the EE distributions are shown as step histograms. Panel (d) directly compares the ME and EE lag distributions and shows that EE has a broader lag range, although its median is not significantly offset from that of ME.
Other Images in This Article
Show More
Copyright and Terms & Conditions
© 2026. The Author(s). Published by the American Astronomical Society.

