

Image Details
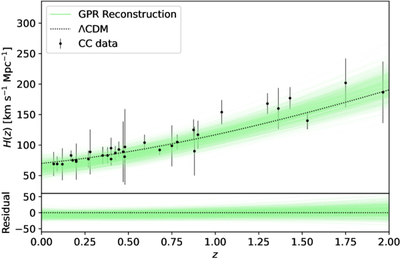
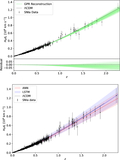
Caption: Figure 5.
The reconstruction of H(z) from the CC dataset based on GPR. Top panel: the black points with error bars denote the CC measurements. The light green lines represent 1000 random samples drawn faithfully from the predictive multivariate Gaussian posterior. The black dotted line indicates the ΛCDM mean function computed using the median values from the MCMC posterior chains. Bottom panel: residuals of the 1000 GPR posterior samples with respect to the median ΛCDM mean function.
Other Images in This Article
Copyright and Terms & Conditions
© 2026. The Author(s). Published by the American Astronomical Society.

Copyright ©
2026 Astronomy Image Explorer. All Rights Reserved.
