

Image Details
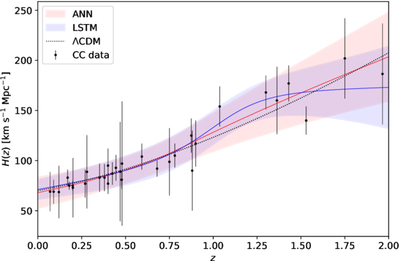
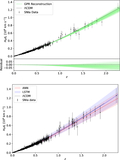
Caption: Figure 6.
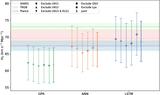
The reconstruction of H(z) from the CC dataset based on ANN and LSTM. The red line and shadow show the ANN’s reconstructed mean values and 1σ uncertainties, while the blue line and shadow represent the LSTM’s predictions. The H(z) from the fiducial flat ΛCDM model is shown as the black dotted line.
Other Images in This Article
Copyright and Terms & Conditions
© 2026. The Author(s). Published by the American Astronomical Society.

Copyright ©
2026 Astronomy Image Explorer. All Rights Reserved.
