

Image Details
A Wide and Deep Exploration of Radio-detected Active Galactic Nuclei with Subaru HSC (WERGS). XII. Final Optical Identification of VLASS Radio Sources from the Subaru/HSC-SSP Wide Survey over 1200 deg2
Hisakazu Uchiyama et al 2026 The Astrophysical Journal Supplement Series 285 .
- Provider: AAS Journals
Caption: Figure 3.
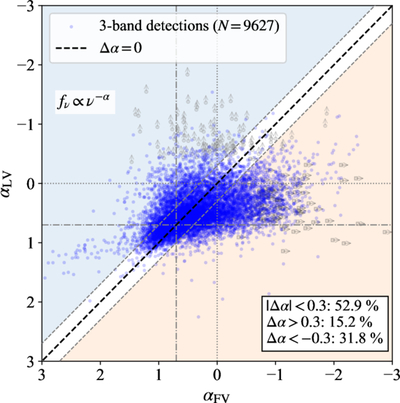
Radio color–color diagram of spectral indices αLV and αFV. Blue points show sources detected in all three radio bands (LoTSS, FIRST, and VLASS), while gray symbols indicate sources detected in only two bands, for which upper limits are shown for the nondetected band. Upward arrows represent upper limits on αLV for LoTSS nondetections, and rightward arrows represent upper limits on αFV for FIRST nondetections, assuming representative flux-density limits of 0.35 mJy (LoTSS) and 0.75 mJy (FIRST). The dashed line indicates αLV = αFV, corresponding to a single power-law spectrum. The dotted lines mark α = 0 and α = 0.7 for reference. The blue- and orange-shaded regions highlight sources with significantly curved radio spectra, defined as Δα < −0.3 (convex) and Δα > 0.3 (concave), respectively. The fractions of sources consistent with power-law (∣Δα∣ < 0.3), convex (Δα > 0.3), and concave (Δα < −0.3) spectra are computed using only the three-band detections and are shown in the bottom-right corner. For clarity, only a random subset of 100 sources is shown for each class of upper limits, corresponding to ∼3% (LoTSS) and ∼7% (FIRST) of the full sample.
Other Images in This Article
Show More
Copyright and Terms & Conditions
© 2026. The Author(s). Published by the American Astronomical Society.

