

Image Details
A Wide and Deep Exploration of Radio-detected Active Galactic Nuclei with Subaru HSC (WERGS). XII. Final Optical Identification of VLASS Radio Sources from the Subaru/HSC-SSP Wide Survey over 1200 deg2
Hisakazu Uchiyama et al 2026 The Astrophysical Journal Supplement Series 285 .
- Provider: AAS Journals
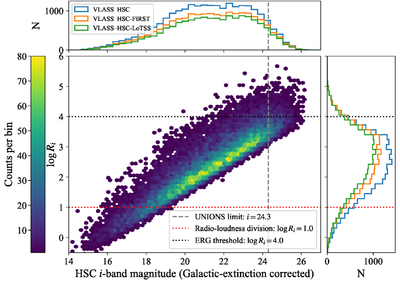
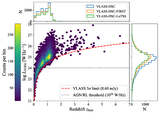
Caption: Figure 11.
Radio-to-optical ratio as a function of optical brightness for our radio-selected samples. The central panel shows the distribution of the radio-to-optical ratio, ﹩\mathrm{log}{R}_{i}\equiv \mathrm{log}({S}_{{\rm{3}}\,{\rm{GHz}}}/{f}_{i})﹩, vs. the Galactic-extinction-corrected HSC i-band cModel magnitude for the Clean VLASS-HSC sample after requiring S/N(i) ≥ 5. The density is displayed using a hexbin representation, with the color scale indicating the number of sources per bin. The top and right panels show the marginal distributions of i and ﹩\mathrm{log}{R}_{i}﹩, respectively, for the Clean VLASS-HSC (blue), Clean VLASS-HSC-FIRST (orange), and Clean VLASS-HSC-LoTSS (green) samples. The vertical dashed line marks the representative UNIONS i-band limiting magnitude (i = 24.3), while the horizontal black dotted line indicates an “extremely radio-loud” threshold at ﹩\mathrm{log}{R}_{i}=4﹩ (see text). We also show the conventional radio-loudness division at log Ri = 1 as a red dotted horizontal line.
Other Images in This Article
Show More
Copyright and Terms & Conditions
© 2026. The Author(s). Published by the American Astronomical Society.

