

Image Details
A Wide and Deep Exploration of Radio-detected Active Galactic Nuclei with Subaru HSC (WERGS). XII. Final Optical Identification of VLASS Radio Sources from the Subaru/HSC-SSP Wide Survey over 1200 deg2
Hisakazu Uchiyama et al 2026 The Astrophysical Journal Supplement Series 285 .
- Provider: AAS Journals
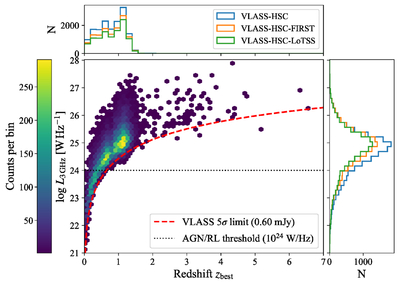
Caption: Figure 10.
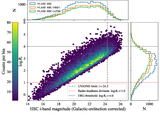
Radio luminosity at 3 GHz (L3GHz) vs. redshift for the Clean VLASS-HSC with reliable photo-z catalog. The central panel shows the distribution in the zbest–﹩\mathrm{log}({L}_{{\rm{3}}\,{\rm{GHz}}}/{\rm{W}}\,{{\rm{Hz}}}^{-1})﹩ plane, where zbest is derived from z_best and L3GHz is derived from L_3GHz_fit_best. The density is displayed as a hexbin map (color indicates counts per bin). The top and right panels show the marginal distributions of zbest and ﹩\mathrm{log}{L}_{{\rm{3}}\,{\rm{GHz}}}﹩ for three subsamples: Clean VLASS-HSC with reliable photo-z (blue), Clean VLASS-HSC-FIRST with reliable photo-z (orange), and Clean VLASS-HSC-LoTSS with reliable photo-z (green). The red dashed curve indicates the VLASS 5σ flux-density limit (0.60 mJy at 3 GHz) converted to a luminosity limit as a function of redshift assuming a spectral index α = 0.7 (Sν ∝ ν−α). The black dotted line marks the commonly adopted radio-loud/AGN threshold, L3GHz = 1024 W Hz−1.
Other Images in This Article
Show More
Copyright and Terms & Conditions
© 2026. The Author(s). Published by the American Astronomical Society.

