

Image Details
A Wide and Deep Exploration of Radio-detected Active Galactic Nuclei with Subaru HSC (WERGS). XII. Final Optical Identification of VLASS Radio Sources from the Subaru/HSC-SSP Wide Survey over 1200 deg2
Hisakazu Uchiyama et al 2026 The Astrophysical Journal Supplement Series 285 .
- Provider: AAS Journals
Caption: Figure 14.
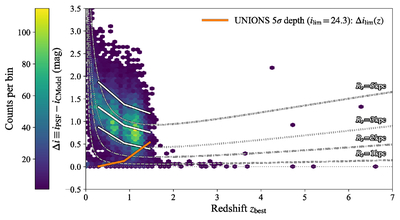
Morphology diagnostic for the extended subsample. We plot the HSC i-band extendedness indicator Δi ≡ iPSF − iCModel as a function of the best-available redshift (zbest). We apply an i-band signal-to-noise cut of S/Ni ≥ 5. Extended sources are then defined by a significance threshold SΔi ≡ Δi/σΔi ≥ 5 and Δi > 0, with ﹩{\sigma }_{{\rm{\Delta }}i}=\sqrt{\sigma {({i}_{{\rm{PSF}}})}^{2}+\sigma {({i}_{{\rm{CModel}}})}^{2}}﹩; only sources passing this extended criterion are shown. Colors indicate the number of objects per hexagonal bin. White solid curves show the 16th, 50th (median), and 84th percentiles of Δi in zbest bins. Gray curves indicate a simple theoretical expectation of Δi for a Gaussian galaxy with physical half-light radius Re = 1–5 kpc convolved with a Gaussian PSF of FWHM = 0﹩\mathop{.}\limits^{{\unicode{x02033}}}﹩7 (a conservative value compared to the typical HSC i-band image quality; e.g., H. Aihara et al. 2018); the conversion from physical size to angular size uses the angular-diameter distance in the Planck cosmology. The orange solid curve provides a detectability guide for a shallower survey such as UNIONS; assuming its nominal i-band depth ﹩{i}_{{\rm{lim}}}\simeq 24.3﹩ (5σ point-source depth), we estimate the magnitude-dependent uncertainty in Δi via ﹩{\rm{S}}/{\rm{N}}(m)=5\times 1{0}^{-0.4(m-{i}_{{\rm{lim}}})}﹩ and ﹩{\sigma }_{{\rm{\Delta }}i}(m)\simeq \sqrt{2}\,(1.0857/{\rm{S}}/{\rm{N}})﹩, and plot the median ﹩{\rm{\Delta }}{i}_{{\rm{lim}}}(z)=5\,{\sigma }_{{\rm{\Delta }}i}﹩ in redshift bins using the observed iCModel distribution.
Other Images in This Article
Show More
Copyright and Terms & Conditions
© 2026. The Author(s). Published by the American Astronomical Society.

