Image Details
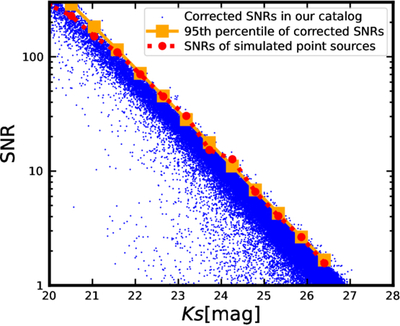
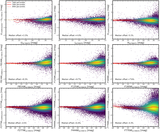
Caption: Figure 7.
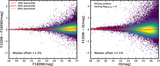
Example of the uncertainty of TPHOT deblending photometry in the Ks band. The blue points show the SNRs reported in our catalog, which have been corrected using 1000 empty apertures with d = 3.5 × FWHMPSF. The orange line shows the 95th percentile of the corrected SNRs, which represents the SNRs of point sources. The red dotted line shows the SNRs of simulated point sources, which are calculated as finput/rmsoutput from the simulated TPHOT photometry. The orange line is almost overlapping with the red dotted line, showing that the flux uncertainties corrected by empty apertures are consistent with the results of simulated photometry.
Other Images in This Article
Show More
Copyright and Terms & Conditions
© 2026. The Author(s). Published by the American Astronomical Society.