Image Details
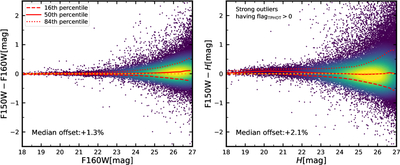
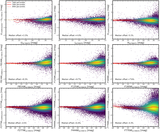
Caption: Figure 8.
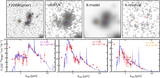
Comparison of ∼1.5 μm flux densities measured from different telescopes with different methods. The left panel compares the photometric results from JWST/NIRCam F150W and HST/WFC3 F160W images, while the right panel compares the results from JWST/NIRCam F150W and VISTA H. The red dashed, solid, and dotted lines show the 16th, 50th, and 84th percentiles of the colors as functions of magnitudes, respectively. We also report the median offset for all sources with SNR > 7 in both bands. These results agree well with almost no bias, and we have checked that most of the strong outliers have been selected to have flag_TPHOT > 0 in our catalog (see Section 3.4).
Other Images in This Article
Show More
Copyright and Terms & Conditions
© 2026. The Author(s). Published by the American Astronomical Society.