Image Details
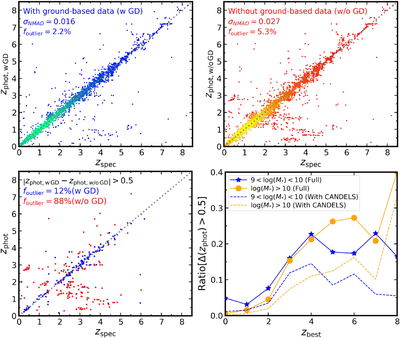
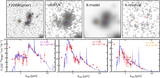
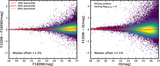
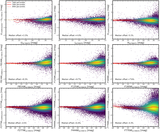
Caption: Figure 12.
Validation of photometric redshifts. Upper left: comparison between photometric redshifts and spectroscopic redshifts in our final catalog with ground-based data. Upper right: the same comparison when we only use the high-resolution data from HST and JWST. Lower left: photometric and spectroscopic redshift comparison for galaxies that have different photometric redshifts (﹩\left|{z}_{\mathrm{phot},{\rm{w}}/\,\mathrm{GD}}-{z}_{\mathrm{phot},{\rm{w}}/{\rm{o}}\,\,\mathrm{GD}}\right|\gt 0.5﹩), where the blue and red points represent the results with and without ground-based data, respectively. Lower right: the ratio of galaxies with different photometric redshifts (﹩\left|{z}_{\mathrm{phot},{\rm{w}}/\,\mathrm{GD}}-{z}_{\mathrm{phot},{\rm{w}}/{\rm{o}}\,\,\mathrm{GD}}\right|\gt 0.5﹩) as a function of redshift. The blue line and orange line shows the ratio of small galaxies (﹩9\lt \mathrm{log}({M}_{* }/{M}_{\odot })\lt 10﹩) and massive galaxies (﹩\mathrm{log}({M}_{* }/{M}_{\odot })\gt 10﹩), respectively. The solid and dashed lines show the ratios in the entire catalog and the region covered by the high-resolution HST data from the CANDELS survey, respectively.
Other Images in This Article
Show More
Copyright and Terms & Conditions
© 2026. The Author(s). Published by the American Astronomical Society.