

Image Details
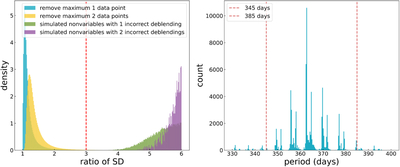
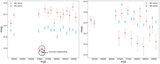
Caption: Figure 5.
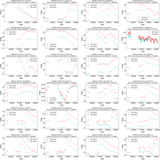
The criteria for filtering out the two types of artifacts. The left panel displays the ratio of the standard deviation before and after the removal of the largest one or two data points, incorporating both the actual data and a rough simulation. The right panel illustrates the distribution of the Lomb–Scargle best period at around 1 yr.
Other Images in This Article
Copyright and Terms & Conditions
© 2026. The Author(s). Published by the American Astronomical Society.

Copyright ©
2026 Astronomy Image Explorer. All Rights Reserved.
