

Image Details
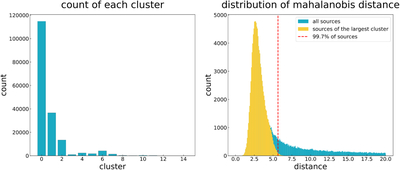
Caption: Figure 3.
The left panel illustrates the distribution of the cluster results derived from the algorithm applied to the 14.5–14.6 subset. The largest cluster corresponded to nonvariable sources. The right panel depicts the Mahalanobis distance of the sources from the center of the largest cluster, highlighting a threshold at the 99.7th percentile of the largest cluster.
Other Images in This Article
Copyright and Terms & Conditions
© 2026. The Author(s). Published by the American Astronomical Society.

Copyright ©
2026 Astronomy Image Explorer. All Rights Reserved.
