

Image Details
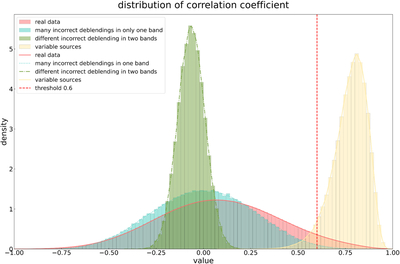
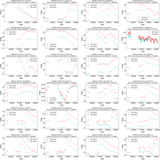
Caption: Figure 2.
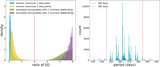
Distribution of cross-correlation coefficients derived from a preliminary simulation. The red segment represents the actual data. The blue segment illustrates the distribution when incorrect deblending occurs in only one band. The green segment depicts the distribution when incorrect deblending occurs in both bands at different times. The yellow segment represents the outcome of a preliminary simulation of the variable sources. Notably, the true number of nonvariable sources is approximately 100 times greater than that of the variable sources.
Other Images in This Article
Copyright and Terms & Conditions
© 2026. The Author(s). Published by the American Astronomical Society.

Copyright ©
2026 Astronomy Image Explorer. All Rights Reserved.
