Image Details
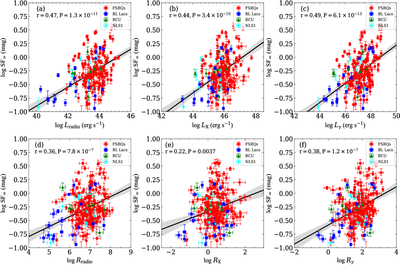
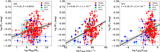
Caption: Figure 5.
(a) The relation between the amplitude of variability and radio luminosity; (b) the relation between the amplitude of variability and 0.3–10 keV X-ray luminosity; (c) the relation between the amplitude of variability and gamma-ray luminosity; (d) the relation between the amplitude of variability and radio loudness; (e) the relation between the amplitude of variability and X-ray loudness; and (f) the relation between the amplitude of variability and gamma-ray loudness. The red dots are FSRQs. The blue dots are BL Lacs. The green dots are BCUs. The cyan dots are NLS1s. The shaded gray colored areas correspond to 1σ confidence bands. The black line is the best fit.
Other Images in This Article


Copyright and Terms & Conditions
© 2026. The Author(s). Published by the American Astronomical Society.