Image Details
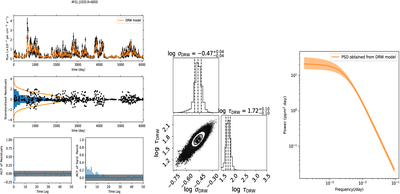
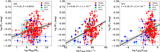
Caption: Figure 1.
The fitting results of 4FGLJ1033.9+6050 are presented as examples. The left panel displays the LAT light curve (black points), along with the modeled light curve (orange line). We present the standardized residuals (black points), the corresponding probability density of these residuals (blue histogram), and the best-fit normal distribution (orange solid line). We also display the ACF of the residuals, along with the 95% confidence limits of white noise represented by the gray region. The middle panel is the posterior distribution of the mode parameters for the DRW. The right panel is the PSD of the DRW. The shaded region represents the 1σ confidence interval.
Other Images in This Article


Copyright and Terms & Conditions
© 2026. The Author(s). Published by the American Astronomical Society.