Image Details
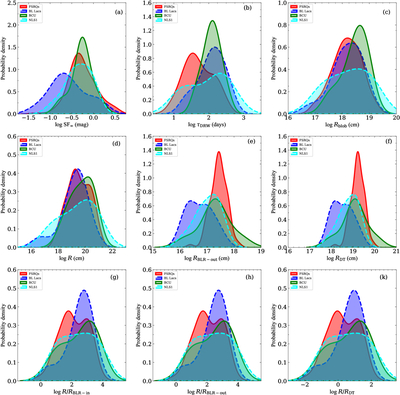
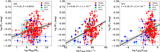
Caption: Figure 3.
(a) The distributions of amplitudes of variability; (b) the distributions of variability timescales in the rest frame; (c) the size of the emitting region in jets (Rblob); (d) the distance of the emission region from the central SMBH (R); (e) the outer radius of the BLR (RBLR−out); (f) the radius of the dusty torus (RDT) for jetted AGNs; (g) the ratio of R/RBLR−in; (h) R/RBLR−out; and (k) R/RDT. The red histogram represents FSRQs. The blue histogram represents BL Lacs. The green histogram represents BCUs. The cyan histogram represents NLS1s.
Other Images in This Article


Copyright and Terms & Conditions
© 2026. The Author(s). Published by the American Astronomical Society.
Copyright ©
2026 Astronomy Image Explorer. All Rights Reserved.