Image Details
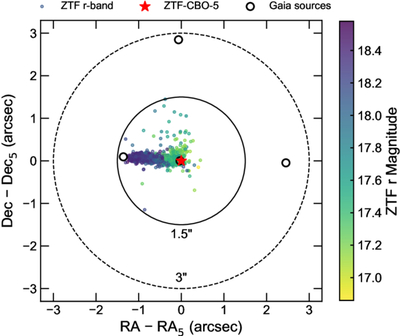
Caption: Figure 7.
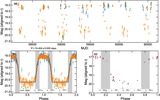
Spatial distribution of ZTF r-band observations within 1﹩\mathop{.}\limits^{\unicode{x02033}}﹩5 of the centroid of ZTF-CBO-5, color coded by magnitude. Nearby Gaia sources are marked by black circles, while the position of ZTF-CBO-5 is indicated by a red star. The spatial distribution of the observations correlates with r-band magnitude, where fainter detections tend to lie closer to the nearby contamination.
Other Images in This Article
Show More
Copyright and Terms & Conditions
© 2026. The Author(s). Published by the American Astronomical Society.
Copyright ©
2026 Astronomy Image Explorer. All Rights Reserved.