Image Details
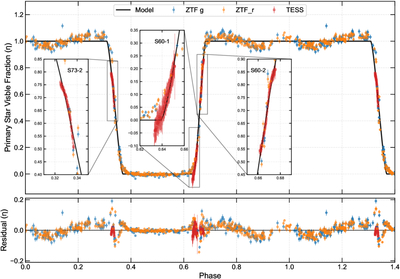
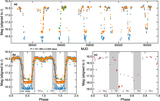
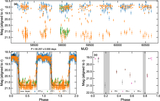
Caption: Figure 3.
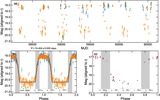
Visible fraction η of the primary star in ZTF-CBO-1, combining ZTF and TESS observations. The light curve from phase 1.0 to 1.4 repeats the segment from phase 0.0 to 0.4 to show both the full outside and during occultation baseline. Inset panels highlight the light curve covered by TESS, which is labeled by sector and dataset number. No significant fluctuations are detected on timescales from hours to days. After egress, the source first reaches a maximum, followed with a fading by ≈0.07 mag, then returns to a second maximum near phase 1.0. This baseline modulation appears symmetric about phase 1.0.
Other Images in This Article
Show More
Copyright and Terms & Conditions
© 2026. The Author(s). Published by the American Astronomical Society.