Image Details
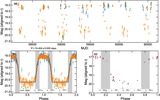
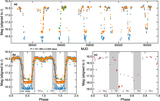
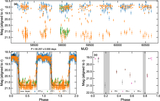
Caption: Figure 2.
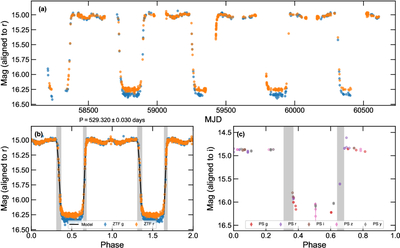
Three views of the ZTF-CBO-1 light curve. (a) Original ZTF light curve spanning multiple years. (b) Phase-folded light curve binned to 0.1 days per point, repeated for two periods to show both the full baseline and the complete occultation. (c) Phase-folded PS light curve. Light curves in each band are shifted vertically to align with the r and i bands for ZTF and PS, respectively. Gray regions in panels (b) and (c) mark the model predicted ingress and egress phases.
Other Images in This Article
Show More
Copyright and Terms & Conditions
© 2026. The Author(s). Published by the American Astronomical Society.
Copyright ©
2026 Astronomy Image Explorer. All Rights Reserved.