Image Details
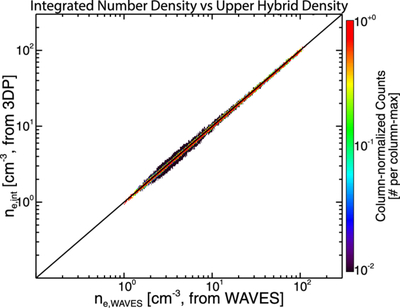
Caption: Figure 4.
A 2D column-normalized histogram of ne,int [cm−3] vs. ne,WAVES [cm−3]. The columns are normalized by the maximum number of counts of all the histogram bins in that column. The diagonal black line shows when ne,int = ne,WAVES. Only data with Quality Flag ≤ 7 are shown (see Appendix D for definitions).
Other Images in This Article
Copyright and Terms & Conditions
© 2026. The Author(s). Published by the American Astronomical Society.
Copyright ©
2026 Astronomy Image Explorer. All Rights Reserved.