Image Details
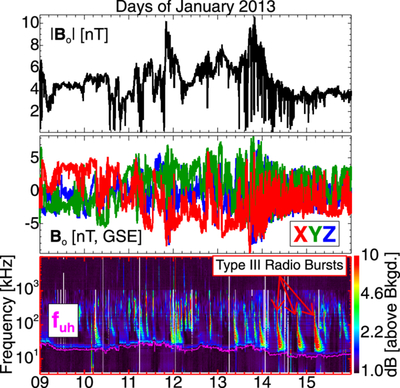
Caption: Figure 2.
Example showing our ability to automatically find fuh during 2013 January. The plot shows, from top to bottom, Bo [nT], GSE components of Bo [nT], and the WAVES radio dynamic spectra data [dB above background]. A few type III radio bursts are labeled for reference. The magenta line in the last panel, marking fuh, has been vertically shifted so the reader can observe the WAVES feature known as the plasma line.
Other Images in This Article
Copyright and Terms & Conditions
© 2026. The Author(s). Published by the American Astronomical Society.
Copyright ©
2026 Astronomy Image Explorer. All Rights Reserved.