Image Details
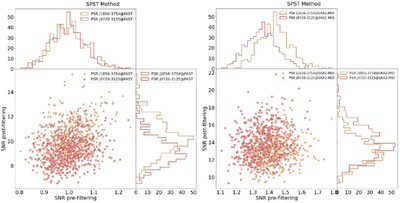
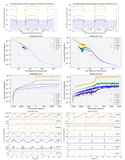
Caption: Figure 21.
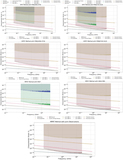
Comparison of the S/N pre- and postfiltering. The panel shows the S/N results of the SPST method, where the data for the left panel are from simulated observations of FAST and the data for the right panel are from simulated observations of SKA2-MID.
Other Images in This Article
Show More
Copyright and Terms & Conditions
© 2026. The Author(s). Published by the American Astronomical Society.
Copyright ©
2026 Astronomy Image Explorer. All Rights Reserved.