Image Details
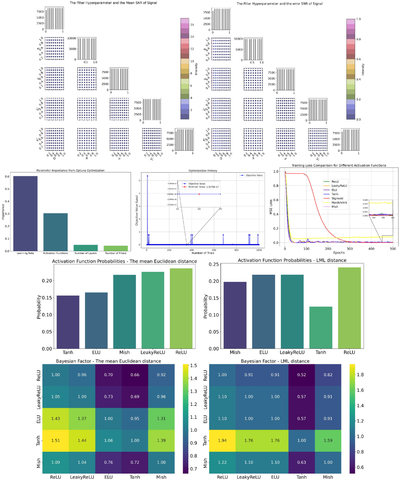
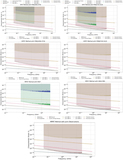
Caption: Figure 18.
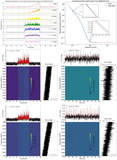
Hyperparameter optimization of a one-dimensional CNN in BCKA filters. The two diagrams in the upper panel illustrate the impact of various hyperparameter configurations of the filter on the S/N and S/N error of the data processing outcomes, which are represented by differently colored scatter plots. The subgraph indicates that we randomly selected two observations from a total of 1000 for filtering. The left subfigure in the second panel illustrates the significance of optimizing the parameters of our one-dimensional CNN using various colored histograms. The middle subfigure presents the optimization history of the neural network, indicating that the lowest loss value, which signifies superior optimization, is denoted by a red dot on the graph. The right subfigure depicts the fluctuation of the loss value of the selected activation function as a function of epoch, represented by different colored solid lines. The change from the third panel to the fourth panel shows the Bayes factor and the priority probability between two instances, using the activation function at two different distances. The graphic indicates that ReLU is the superior activation function.
Other Images in This Article
Show More
Copyright and Terms & Conditions
© 2026. The Author(s). Published by the American Astronomical Society.