Image Details
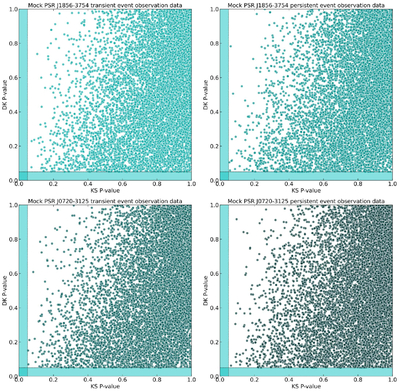
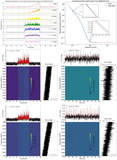
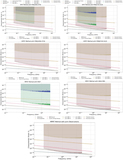
Caption: Figure 17.
Joint distribution of Gaussian test outcomes for simulated data. We provide the outcomes of simulated data testing for four event sets with two pulsars across two distinct timescales, highlighting locations that deviate from the Gaussian distribution with light blue shading.
Other Images in This Article
Show More
Copyright and Terms & Conditions
© 2026. The Author(s). Published by the American Astronomical Society.
Copyright ©
2026 Astronomy Image Explorer. All Rights Reserved.