Image Details
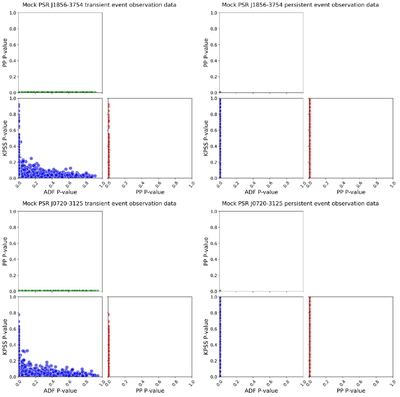
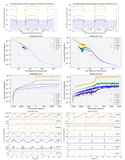
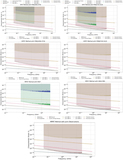
Caption: Figure 16.
Joint distribution of stationarity test results for mock observations. We show the results of mocked data tests for four sets of events containing two pulsars on two different timescales, where the different joint distributions are represented by scatter plots in different colors.
Other Images in This Article
Show More
Copyright and Terms & Conditions
© 2026. The Author(s). Published by the American Astronomical Society.
Copyright ©
2026 Astronomy Image Explorer. All Rights Reserved.