Image Details
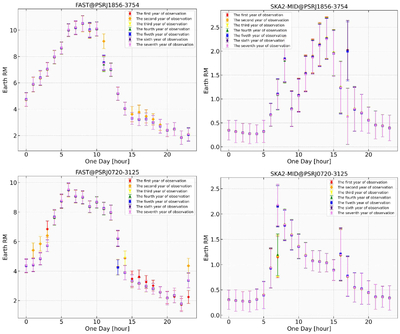
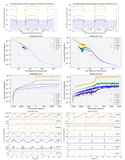
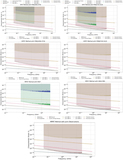
Caption: Figure 15.
Simulation of the RM of the Earth’s ionosphere on June 1 of each year of the seven-year observation period. We use different colors and shapes to represent different years of RM and different years of RM errors are represented by the corresponding colors. The top panel shows the RM in the LOS direction during the observation of pulsar J1856-3754, and the bottom panel demonstrates the RM in the LOS direction during the observation of pulsar J0720-3125. The left panel displays the simulated observation conducted with FAST, whereas the right panel presents the simulated observation performed with SKA2-MID.
Other Images in This Article
Show More
Copyright and Terms & Conditions
© 2026. The Author(s). Published by the American Astronomical Society.