Image Details
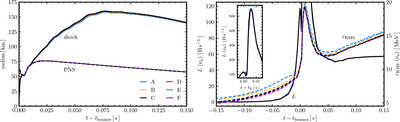
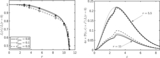
Caption: Figure 32.
Results from the spectral resolution study, showing selected quantities vs. time from simulations in which the parameters of the spectral grid were varied, while the spatial resolution corresponds to a minimum finite-volume radial cell width of 0.5 km at the highest AMR level. The left panel shows the shock (solid lines) and PNS (dashed lines) radii as functions of time, and the right panel shows the electron-neutrino luminosity (solid lines) and rms energy (dashed lines) at r = 500 km as functions of time. Line colors indicate the spectral grids listed in Table 2: Grid A (blue), Grid B (yellow), Grid C (black), Grid D (red), Grid E (green), and Grid F (purple).
Other Images in This Article
Show More
Copyright and Terms & Conditions
© 2026. The Author(s). Published by the American Astronomical Society.