Image Details
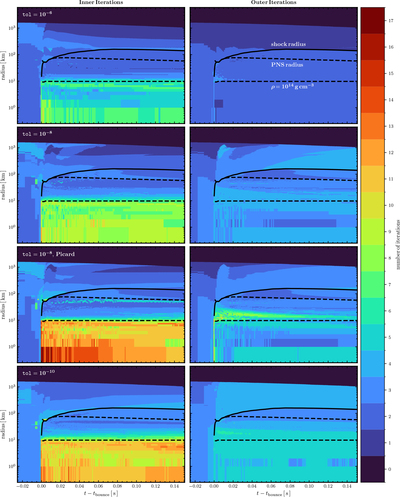
Caption: Figure 27.
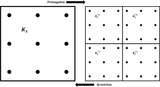
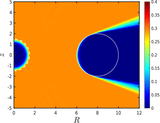
Heat maps of the number of inner (left column) and outer (right column) iterations as functions of radius and time after bounce, from spherically symmetric core-collapse simulations. Rows correspond to different nonlinear solver tolerances and iteration strategies: the top row shows results for tol = 10−6 with Anderson acceleration (M_outer = M_inner = 2); the second row shows tol = 10−8 with Anderson acceleration (M_outer = M_inner = 2); the third row shows tol = 10−8 with Picard iteration (M_outer = M_inner = 1); and the bottom row shows tol = 10−10 with Anderson acceleration (M_outer = M_inner = 2). In each panel, the shock radius (solid black line), the PNS radius (dashed black line), and the ρ = 1014 g cm−3 contour (dashed black line) are indicated.
Other Images in This Article
Show More
Copyright and Terms & Conditions
© 2026. The Author(s). Published by the American Astronomical Society.